

What is the population stability index (PSI)?
PSI is a measure of how much a population has shifted over time or between two different samples of a population in a single number. It does this by bucketing the two distributions and comparing the percents of items in each of the buckets, resulting in a single number you can use to understand how different the populations are. The common interpretations of the PSI result are:
- PSI < 0.1: no significant population change
- PSI < 0.2: moderate population change
- PSI >= 0.2: significant population change
How is PSI used?
There are two different ways PSI can be used to make good decisions in a machine learning model building context:
Reactive Re-training Triggers
After a deploying a ML model into production, it will continue to provide estimates on the population it was trained on. As the population shifts over time, the estimates become less accurate and relevant to the current population, and monitoring the PSI score from the time of model training to current time can be used as automatic triggers to re-train the model when PSI passes a certain threshold (0.2 for example).
Proactive Feature Selection
When choosing features to go into a model, certain features may have a lot of predictive power at the time of training, but if a feature is prone to rapid changes in distribution, it may not be a wise decision to include it in the model or it may prompt more frequent monitoring once deployed. PSI is an easy way to check the volatility of population changes for features by comparing populations for several previous time periods.
Example Walkthrough
Here’s a quick example of walking through the steps of a PSI calculation for two (mostly) normal distributions.
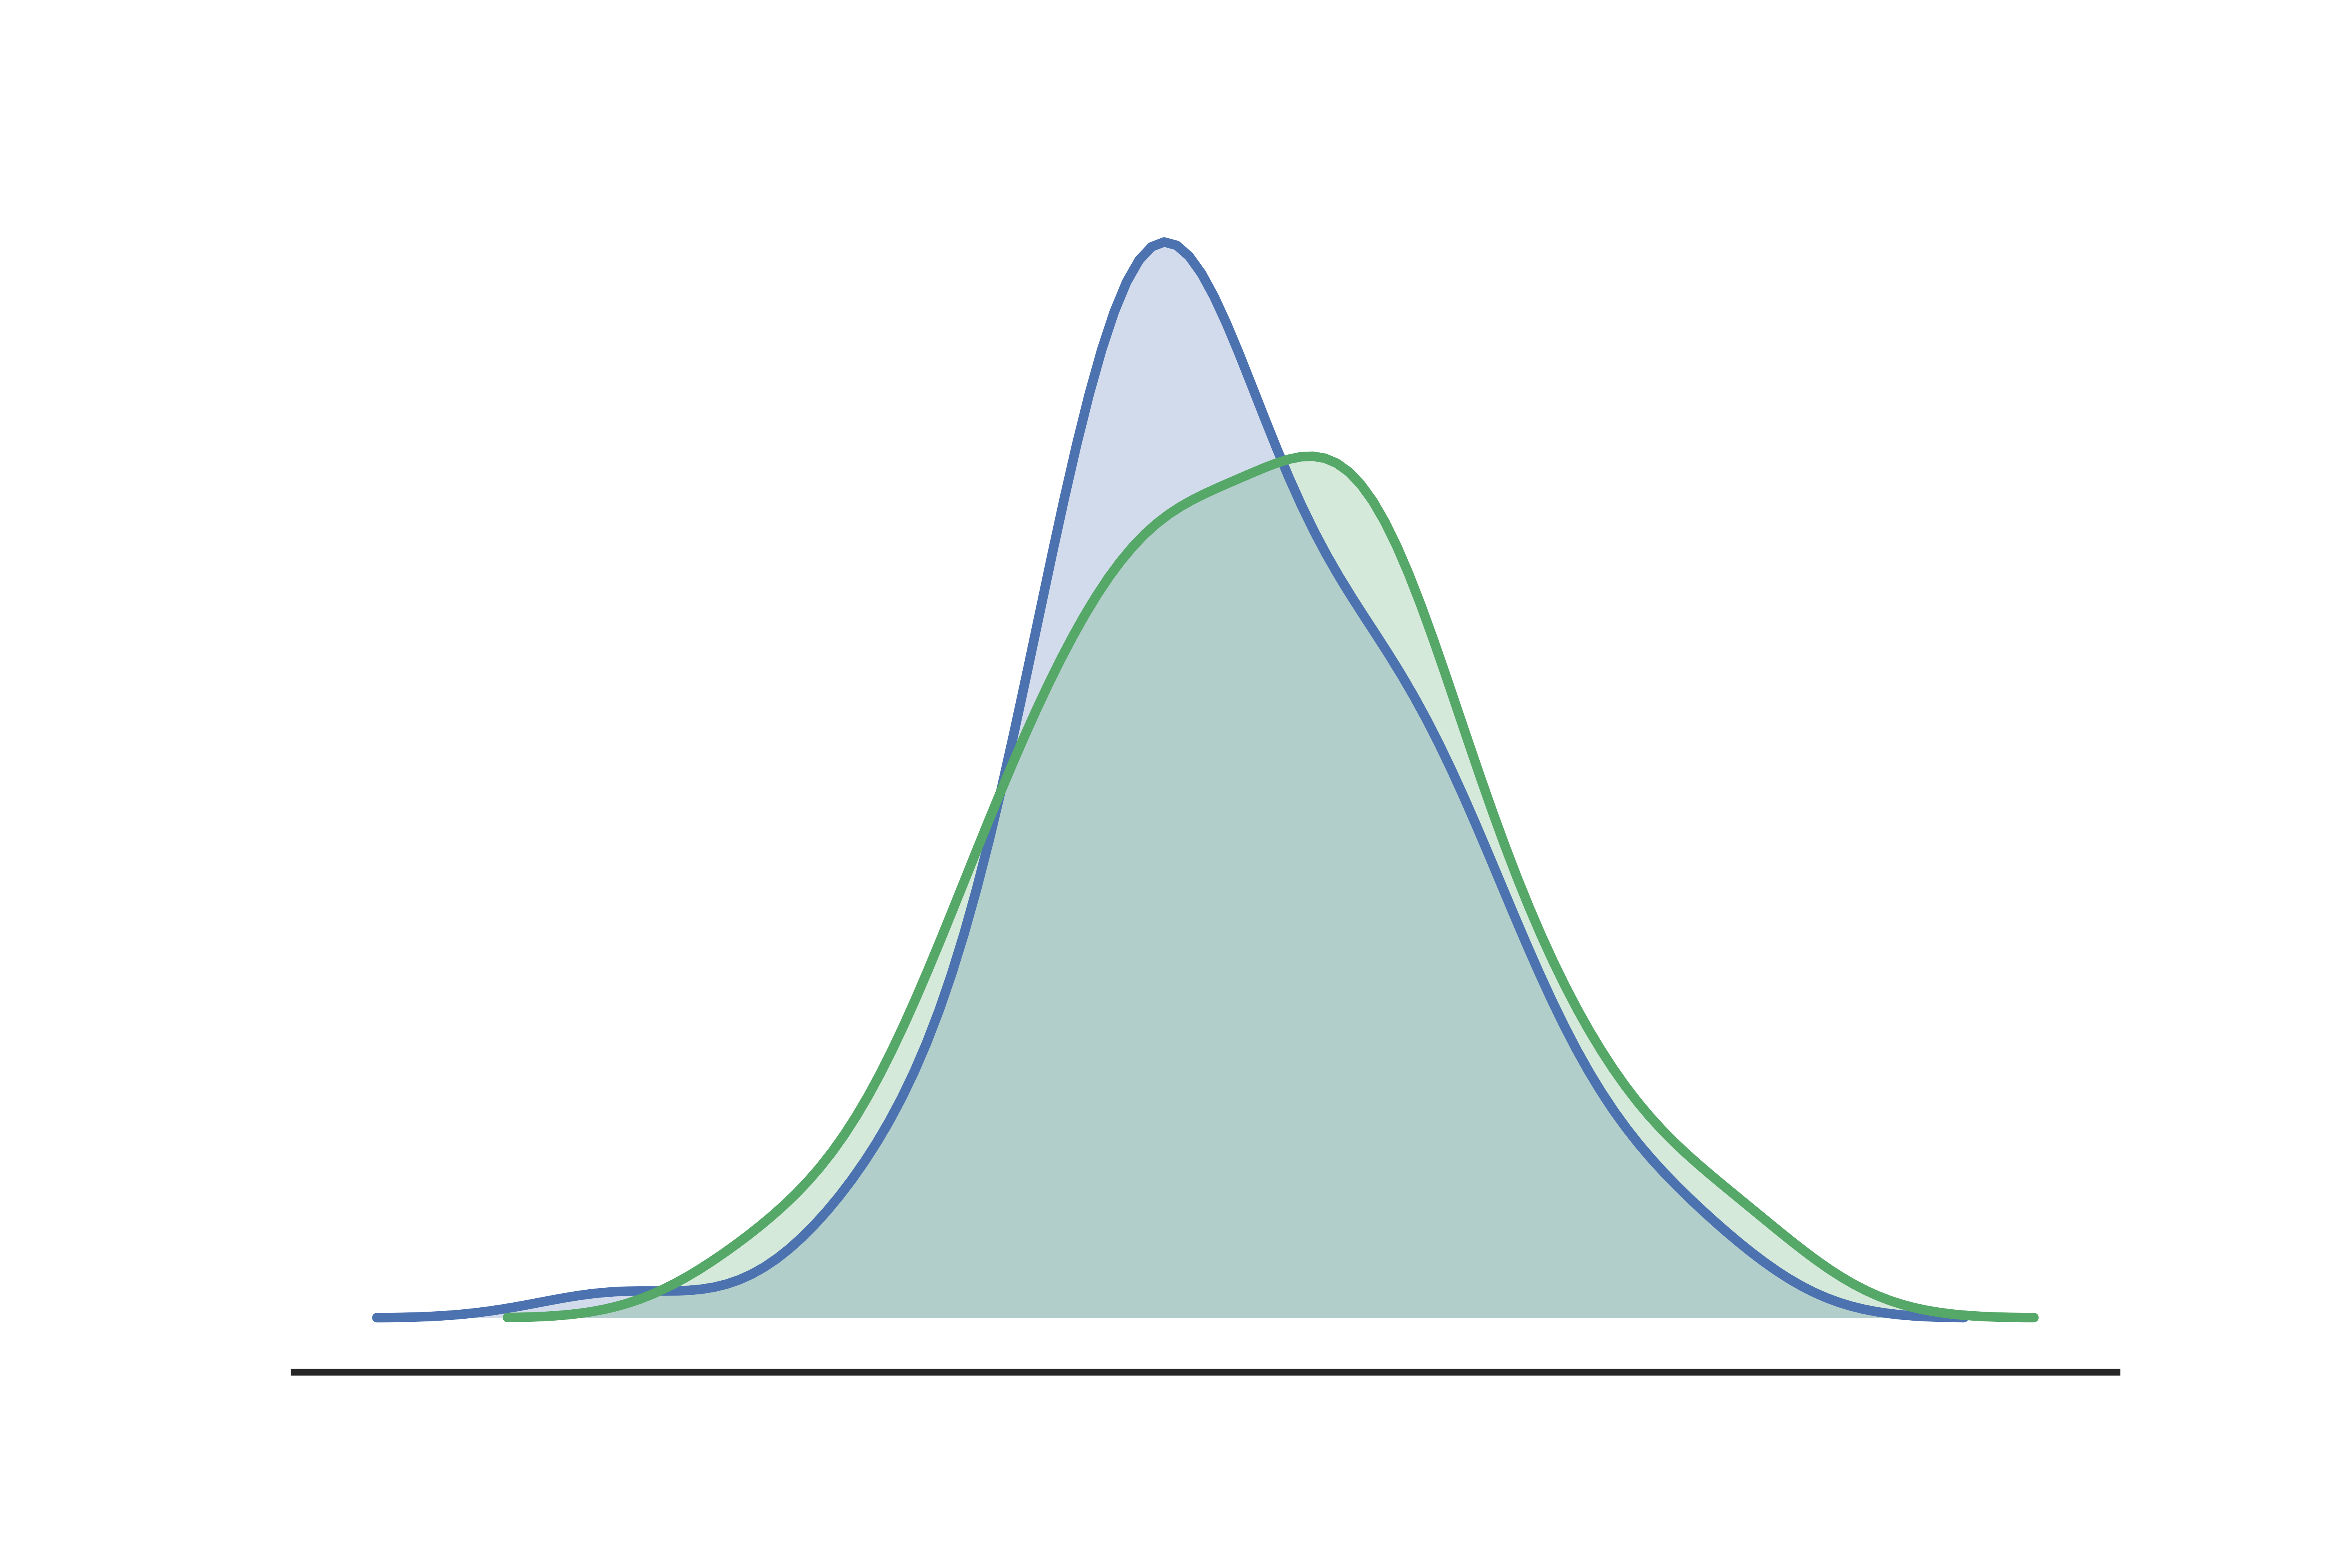
As you can see above, the slightly left-skewed initial population (blue) has flattened out a bit to have more of a flat top of the bell curve in the new population (green). From a visual inspection, it looks as if the population is shifting, but I would like a quantitative way to measure how much the shift is rather than qualitatively guessing how much I should be concerned. PSI is a great way to come up with a single metric to measure this.
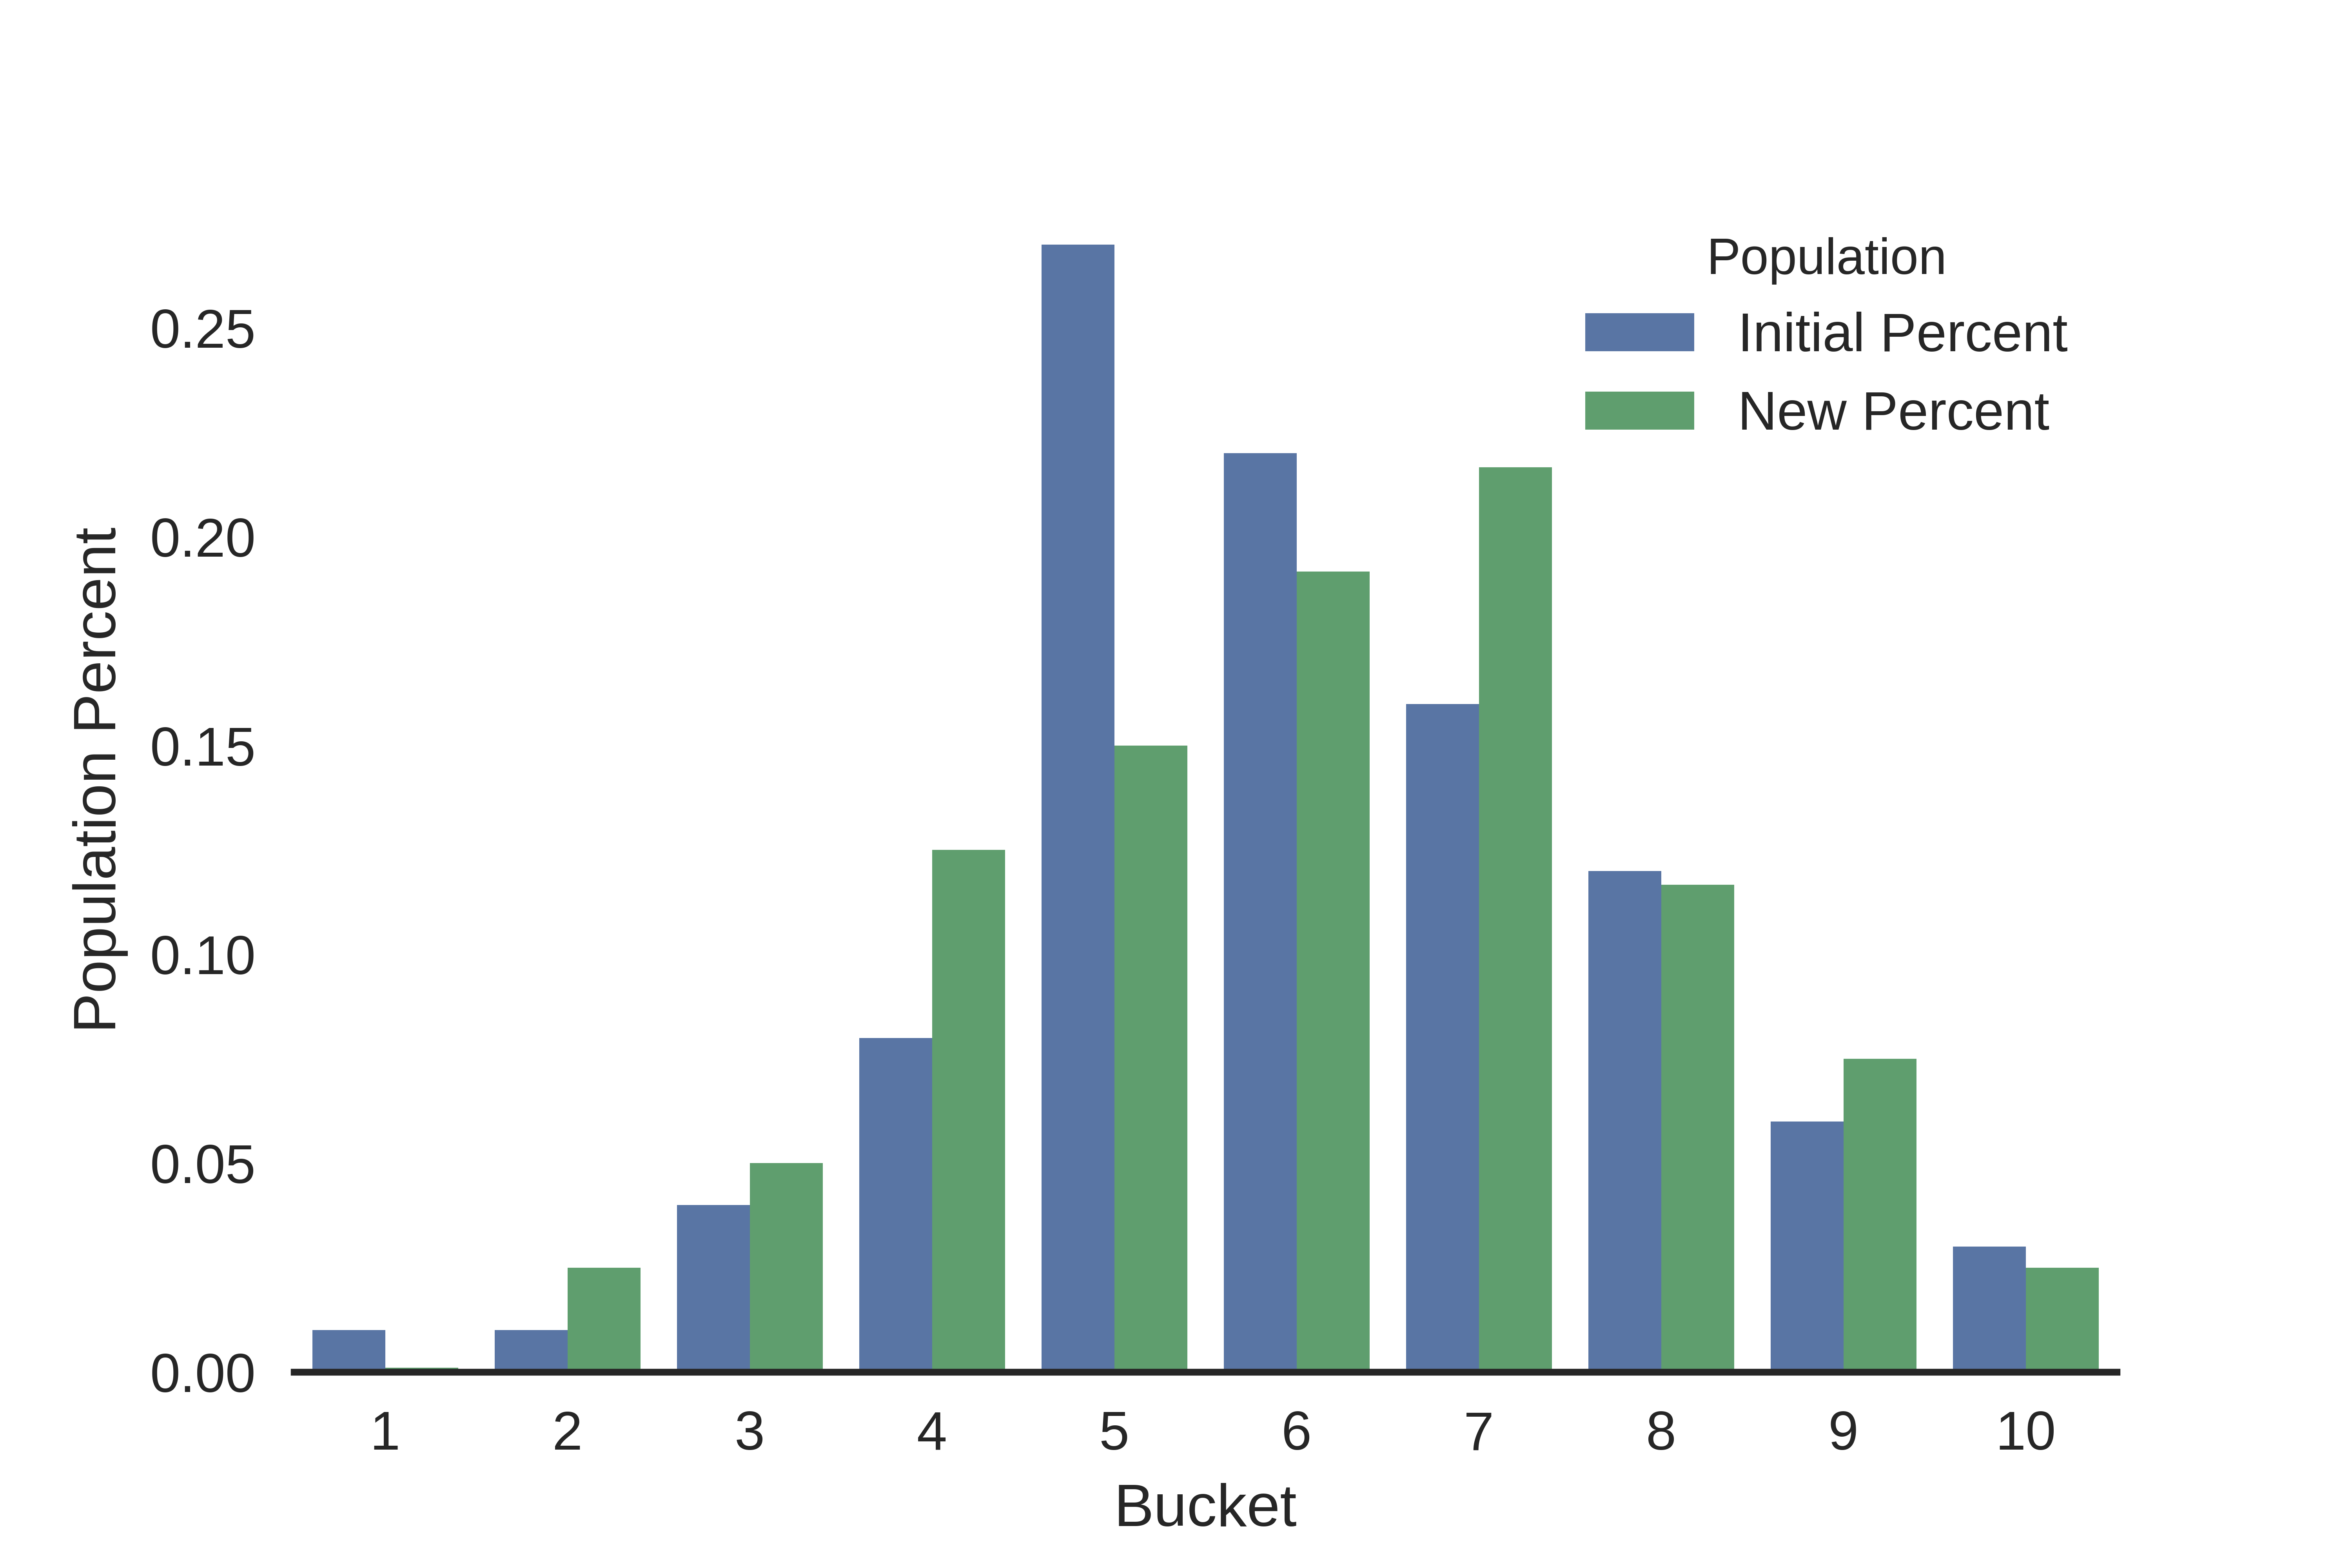
To calculate the PSI we first divide the initial population range into 10 buckets (an arbitrary number I chose), and count the number of values in each of those buckets for the initial and new populations, and then divide those by the total values in each population to get the percents in each bucket. As expected, plotting the percents ends up looking like a discretized version of the original chart:
From here, we perform the actual PSI calculation for each bucket, and them sum them all up to get the overall PSI values for the distributions.
PSI Formula:
\[PSI = \sum{}\Big(\big(Actual \% - Expected \%\big) \times ln\big(\dfrac{Actual \%}{Expected \%}\big)\Big)\]| Breakpoint Value | Bucket | Initial Count | New Count | Initial Percent | New Percent | PSI |
|---|---|---|---|---|---|---|
| -2.330642 | 1 | 1 | 0 | 0.01 | 0.001000 | 0.020723 |
| -1.801596 | 2 | 1 | 3 | 0.01 | 0.025000 | 0.013744 |
| -1.272550 | 3 | 4 | 6 | 0.04 | 0.050000 | 0.002231 |
| -0.743504 | 4 | 8 | 15 | 0.08 | 0.125000 | 0.020083 |
| -0.214458 | 5 | 27 | 18 | 0.27 | 0.150000 | 0.070534 |
| 0.314588 | 6 | 22 | 23 | 0.22 | 0.191667 | 0.003906 |
| 0.843633 | 7 | 16 | 26 | 0.16 | 0.216667 | 0.017181 |
| 1.372679 | 8 | 12 | 14 | 0.12 | 0.116667 | 0.000094 |
| 1.901725 | 9 | 6 | 9 | 0.06 | 0.075000 | 0.003347 |
| 2.430771 | 10 | 3 | 3 | 0.03 | 0.025000 | 0.000912 |
Interpretation:
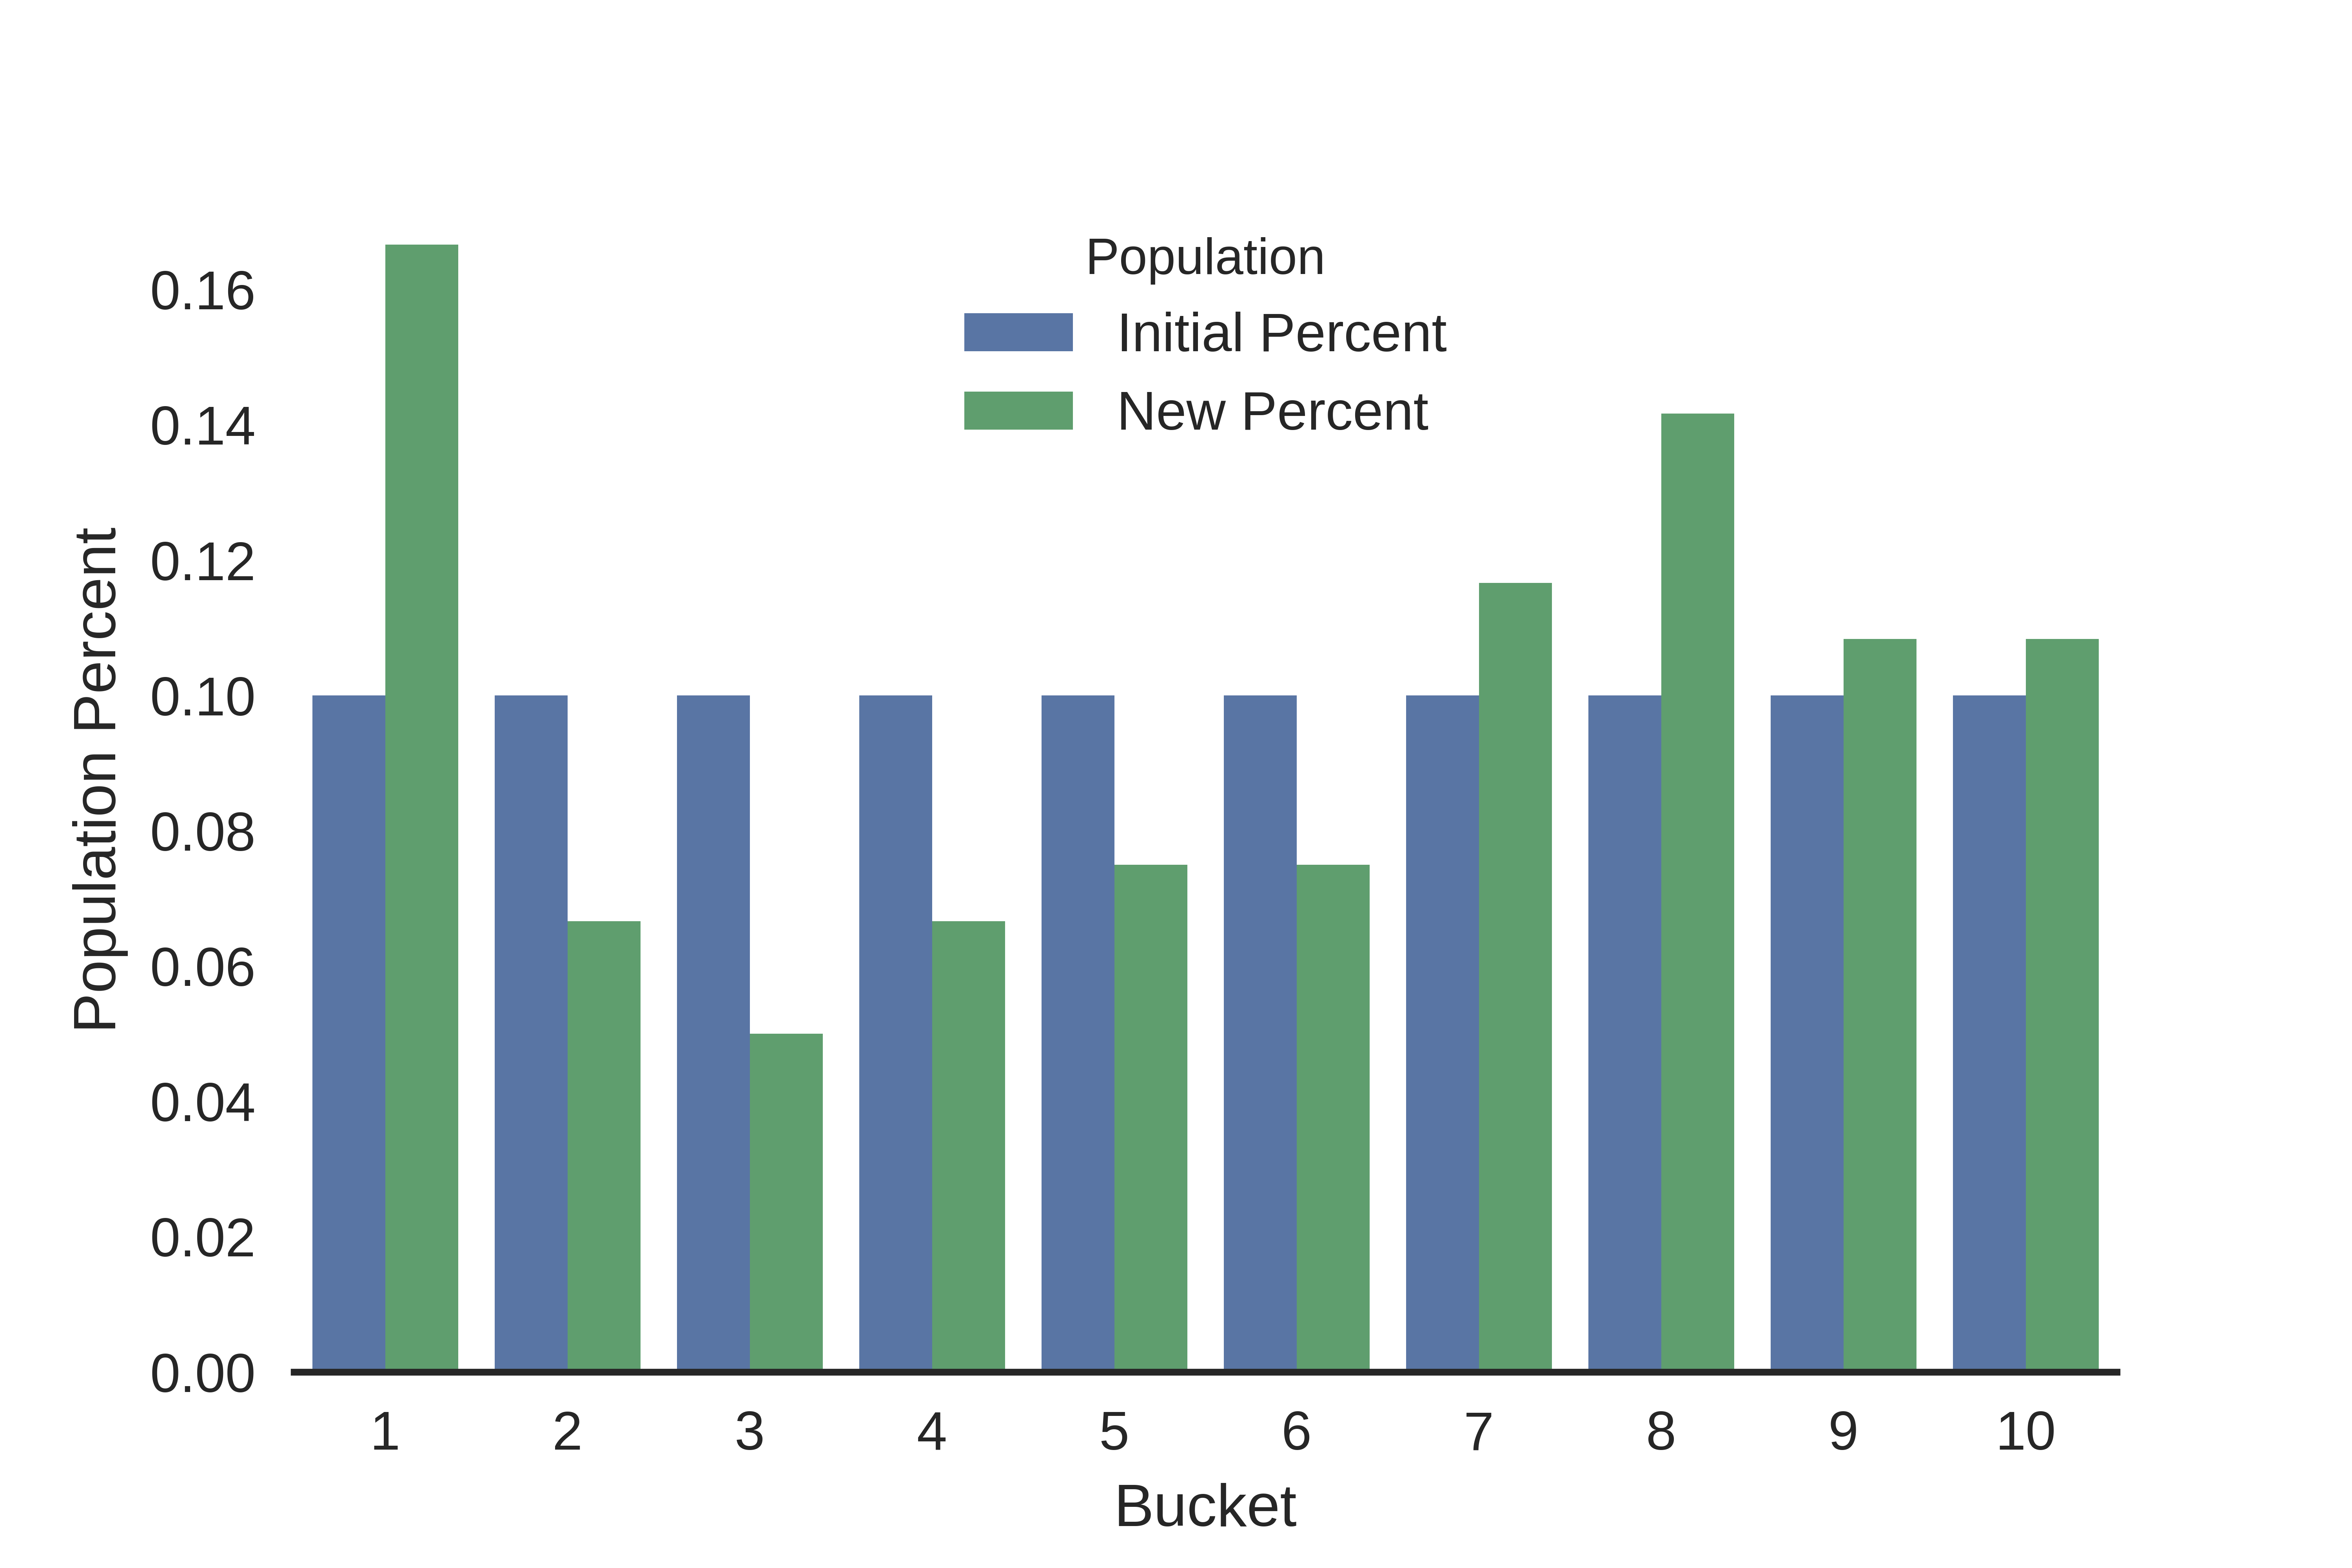
We get a final PSI value of 0.153, which indicates that there’s a chance our population is shifting, and we may want to monitor it going forwards. Of course, this is just one way of calculating PSI by using equal size binning of 10 buckets. If we keep the 10 buckets but change our binning strategy to quantile bins, we end up with a different percent distribution and an overall lower estimate of 0.129.
Final Thoughts
PSI seems to be a metric primarily used in the financial industry, but I think it can have a lot of useful applications in the wider ML community when used widely and consistently.
References
- https://www.lexjansen.com/wuss/2017/47_Final_Paper_PDF.pdf
- https://www.listendata.com/2015/05/population-stability-index.html
- https://www.quora.com/What-is-population-stability-index
Python Implementation
Check out my python implementation of PSI and a corresponding python notebook going through the example above at this repo.
Some assumptions the code makes:
- Numpy is the only non-standard library dependency
- Assumes continuous variables (categorical variables are handled differently in PSI)
- Replaces bins in the new population that have 0 count with 0.001 percent to avoid divide by zero errors without affecting overall calculation too much