


Slopegraphs are great …sometimes
A slopegraph is a relatively underused chart with two sets of values on the left and right hand side, connected by lines. I know this sounds like a line chart with two values… and it kind of is… but trust me it has its uses.
Slopegraphs were first developed by the illustrious Edward Tufte, and you can see an example of one in his book The Visual Display of Quantitative Information below:
The slopegraph is successful in accomplishing the following communication goals:
- Showing relative rankings of items
- Identifying magnitude of changes
- Allowing comparison of changes among items
Slopegraph vs bar chart
Although these tasks could be accomplished by reading a bar chart, I believe a slopegraph is a more appropriate visualization in some cases.
One example is taken from KDnuggets poll of data science software usage in recent years. From their bar chart below, you can get see trends by looking at each piece of software individually, but it’s difficult to compare across all of them.

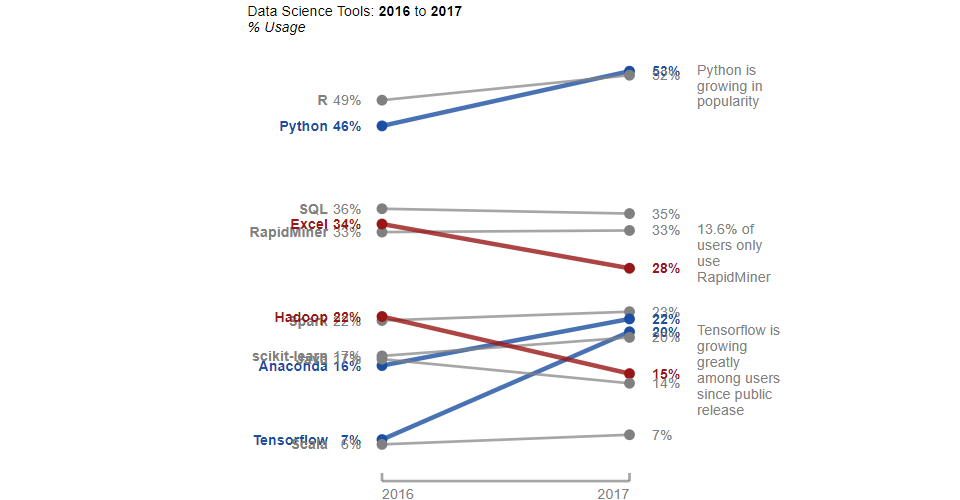
To illustrate how this could be improved, I created a slopegraph for the some of the top items in D3 and posted a screenshot below.
Data Science Tools % Usage: 2016 to 2017
Slopegraph pros
The slopegraph makes better use of color to draw the reader’s eyes to significant changes, and immediately informs them of the increase or decrease. In the previous chart, the colors held no inherent meaning, and therefore added visual complexity for no additional benefit to the reader.
Additionally, I think the sloepgraph gives a better sense of the overall average trends through the line angles.
Slopegraph cons
One of the primary shortcomings of the chart is the overlap of items with similar values. I had to add some extra logic in order to avoid this and still ended up with the SQL/Excel abomination, whereas if I used a bar chart, I would never have this problem.
The human brain is more suited to make comparisons between values based on length rather than angle, and I wouldn’t be able to determine whether a line reprsented a 7% or 8% increase innately, which is why you need to add in each of the percents on both sides of the chart.
Summary
Every visualization tool has bar chart capabilities and every powerpoint will inevitably have at least one bar chart mainly because you won’t have to explain to your boss how to read a bar chart. They just work.
That being said, they don’t always work as well as they could, and I think putting in a little extra time coding up a custom slopegraph visualization in something like D3 can make a significant difference in guiding people to the insights you’ve dug up.
References
The code for the above slopegraph made with D3.js can be found in this github repo
You can view a live version in this block