


Over Thanksgiving, some friends of mine set out to find the best pumpkin pie recipe and in the process, baked 5 different pies for comparison. After enjoying and ranking them, they decided to open the survey population to let others determine what the truly best pie was with a blind taste test. Being a data nerd himself, my friend tracked all of these responses and passed htem onto me so that I could take a stab at visualizing them with a new data interactive visualization framework I had recently discovered.
Idyll
Idyll is, according to their website, “a toolkit for creating data-driven stories and explorable explanations” that makes it simple and quick to create interactive visualizations, and in my opinion, it’s the easiest tool out there to get involved with the communication medium of “scrollytelling”. The base .idyll file that renders into the final webpage is based on Markdown, but it has a few features that make it an extremely effective tool to prototype quickly but still support more advanced work.
React Integration
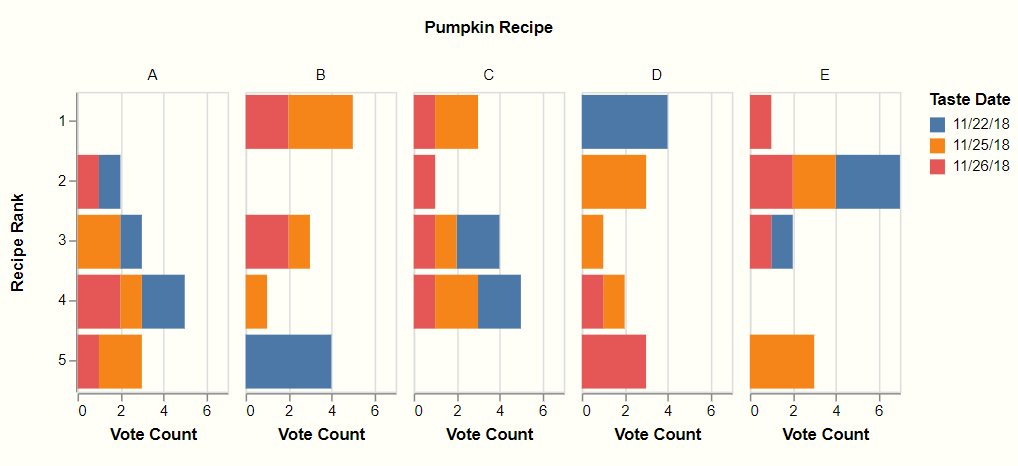
One of the most powerful aspects is that it is integrated with React so enable the easy inclusion of pre-made components. It natively has support for a set of simple graphs generated from csv or json files. I wasn’t able to generate what I wanted with these, so I went ahead and added vega-lite through npm and within a few minutes had a new chart from my existing data source.
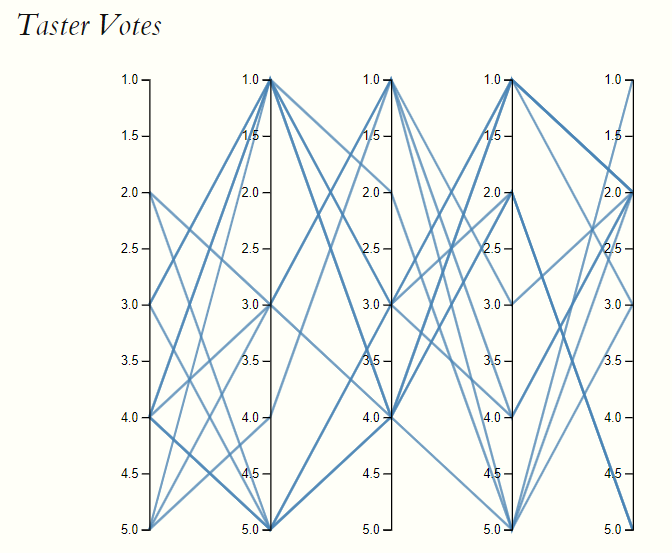
Additionally, it’s fairly straightforward to take existing d3 visualizations, make a few minor modifications, wrap them in a React component and them embed onto your page. In my test, I included a parallel coordinates chart taken directly an Observable notebook, changed a few lines of CSS and had a working chart much faster than I expected.
Property Management
The other fantastic feature of Idyll is the ability to create and manage variables with properties you can both acacess in your different components as wlel as recalculate in real time based on user input.
For example, I can have a variable that can be modified from a variety of pre-made source including a button, slider, text, scroll trigger, etc that can in turn update any visualizations on the page with the new properties. I don’t have to write any additional event listeners and can reuse these properties wherever I want to on the page. I didn’t leverage a ton of these features other than reusing some of my data files and visualization configuration parameters such as width/height, but the possibilities really are endless.
Getting Started with Idyll
If you would also like to get started with Idyll for your own projects, you can take a look at the full post I created with Idyll and the underlying code to see how it was generated, and then head on over to Idyll’s Example Gallery page to see amazing work on how far you can take this framework.
What’s the Catch?
Tools always have tradeoffs and Idyll embraces a markdown-like language which allows quick development. For more advanced visualizations and custom triggers, it may be worth choosing a more flexible for time-consuming framework to get the exact effects you want.
Additionally, the work only supports single-post rendering as of now, and the user has to create their own process for hosting multiple posts on a single website/platform. There are a few options out there trying to deal with this, but according to this github issue, it looks like they’re beginning development to support this.
Further Reading
Here are some great sites to understand the potential of what can really be done with interactive visualization for storytelling and data communication.